Chapter 9 Making Plots in R
Summary: There are two basic ways to create plots in R: 1) with ggplot2 R package and 2) with base R. This chapter is divided into these two approaches, plus some helpful tips on color
9.1 ggplot2
The package ggplot2 is part of R tidyverse. It’s designed to help create plots with aesthetics that make it easy to plot your data in clean and visually appealing ways. These plots are publication-ready and fairly. The main advantage of ggplot2 over base R is that it aligns the text and plot boundaries automatically so you don’t have specify exactly where you want those aspects to be printed.
The main trick with using ggplot2 is to get your data in the correct format. Once it’s in the correct format, you can create any type of ggplot. ggplot2 plots perform best when data are in the ‘long’ format. The ‘long’ format for data has a column for every dimension and a row for every observation (or record).
Below is an image from Data Carpentry’s R for Ecologists lesson: Manipulating, analyzing and exporting data with tidyverse.

Get your data into this format first. In addition to the Data Carpentry tips above, here are some additional tips:
Converting data between wide and long format
The main ggplot2 site is a great place to start to search for types of plots to apply (it includes many examples).
install.packages('ggplot2')
library(ggplot2)
The Data Carpentry R for Ecologists lesson has good tips on getting started with ggplot2: Data visualization with ggplot2.
We recommend learning to use ggplot2 for plotting data in R.
9.2 Base R plotting
9.3 Color on plots
Here are some great resources on color in R plots.
Keep in mind these general rules for using color: Avoid colors that are indistinguishable by someone who is color blind. You can refer to specific HEX, RGB, or CMYK codes for specific colors.
Colorbrewer is a great tool to use for selecting the type of color scheme. You can even select options for colorblind.
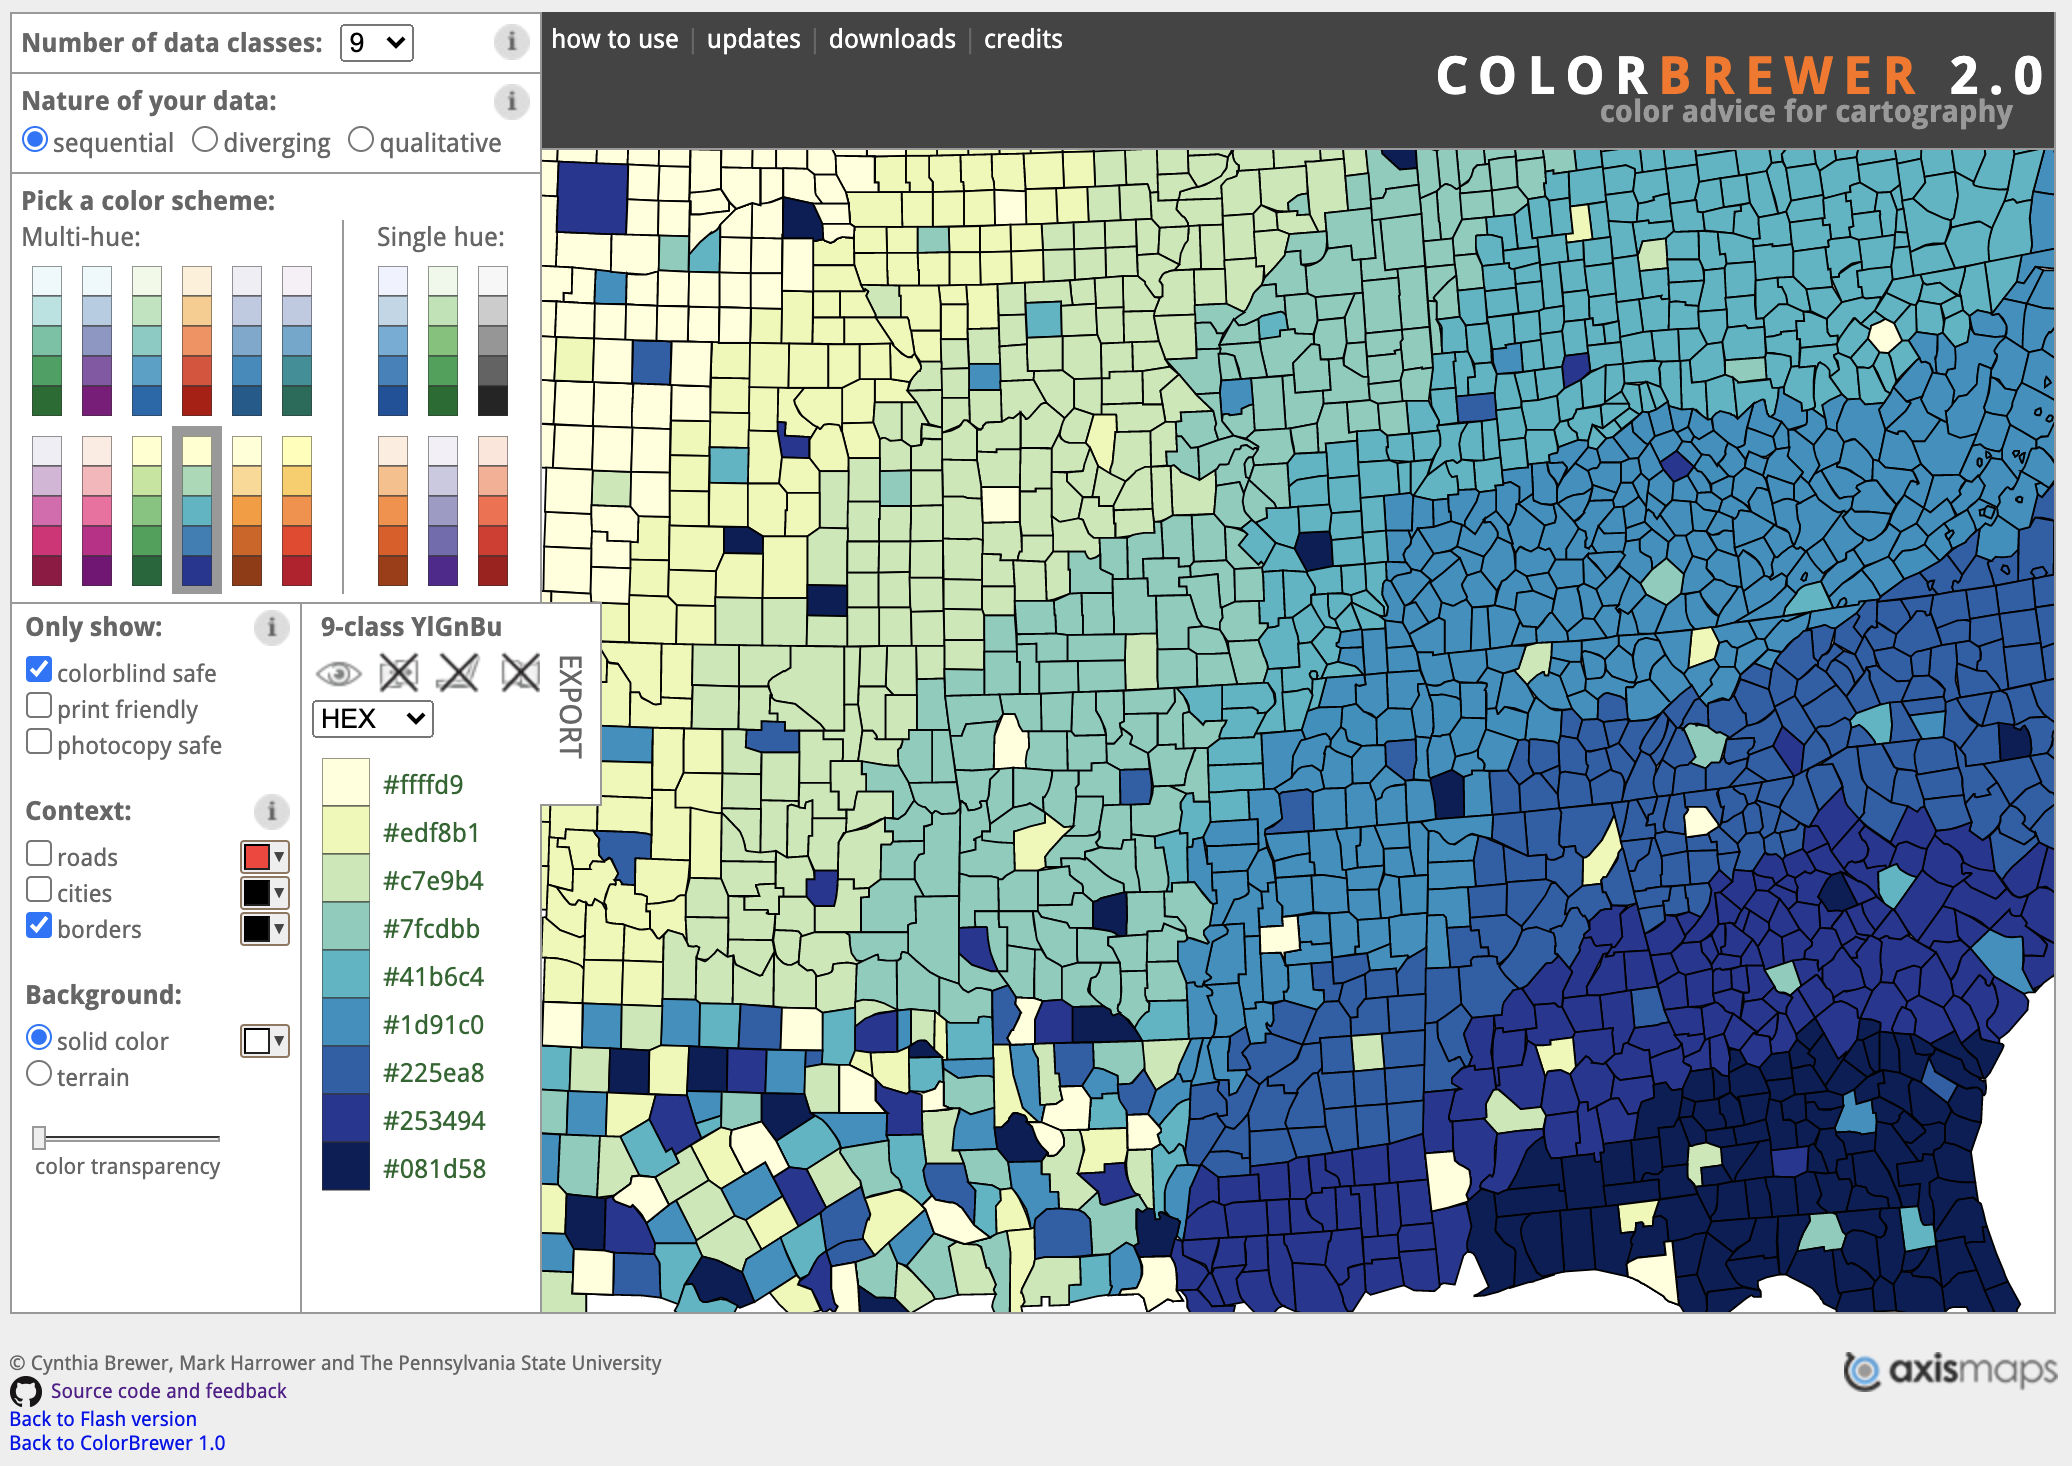
ggplot2 scale_brewer includes the colorbrewer color palettes.
NCEAS has a great cheat sheet on color in R
People have created lots of fun palettes to use. Here’s one based on the diversity of Maize.
devtools::install_github("AndiKur4/MaizePal") 9.4 Plotting spatial data in R
R has come a long way in being able to reproduce publication-quality maps and spatial data that were historically only possible (for nice maps) with programs like ArcGIS or QGIS. We recommend using R to plot spatial data because it will be reproducible.
Here are some great resources on plotting spatial data in R:
Making maps with R is one chapter in the larger book, Geocomputation with R, which is fully available online.